Financial Time-Series Analysis
Testing changing time series and modelling their long-term relationships in Python.
Context: MSc Financial Engineering group coursework, WorldQuant University
Tools: Python, pandas, NumPy, statsmodels, Matplotlib
Two series can move together without one causing the other. A shared trend can also make a simple regression look more convincing than it should. I investigated how to separate a changing trend from a relationship that remains stable over time.
My contribution
I completed the analysis and written answers for the time-series and autocorrelation sections of a financial econometrics group project.
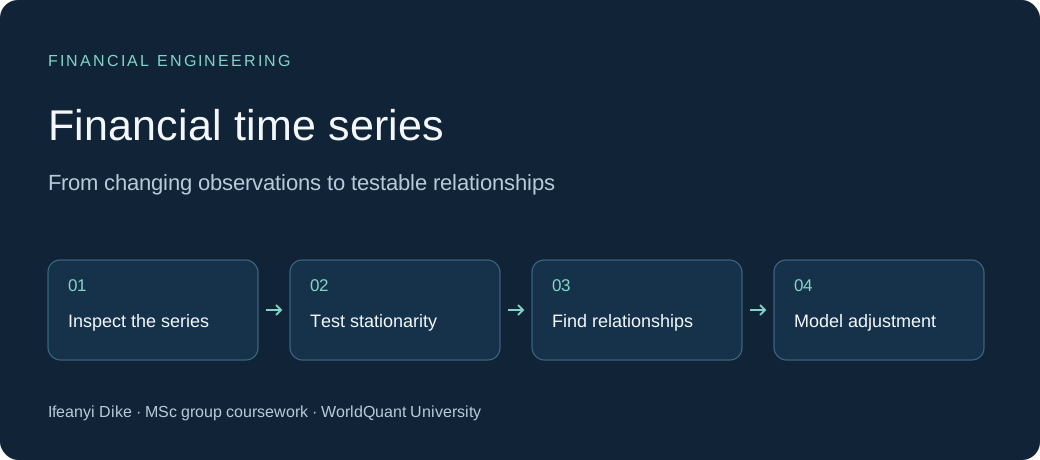
- Analytical work: Derived why the supplied processes were non-stationary and identified combinations that remove their shared trend.
- Stationarity tests: Used Augmented Dickey-Fuller tests on three supplied series, then repeated the tests after taking first differences.
- Long-term relationships: Used Johansen tests to estimate how many stable relationships the series shared.
- Model fitting: Fitted a vector error-correction model, or VECM, to examine adjustment around those relationships.
- Time-series foundations: Derived moving-average representations and autocorrelation relationships for autoregressive processes.
A VECM models changes in related series while accounting for departures from their long-term relationships. It gives a more specific account of their joint behaviour than a plot showing that they move together.
What the results supported
The saved results supported two cointegrating relationships among the three supplied series under the chosen test settings. I compared those statistical findings with the relationships derived from the stated processes.
The exercise connected the mathematics to an implementation: derive a relationship, inspect the data, choose a test, fit a model and explain what the result supports.
What I learned
A result needs its assumptions attached. Test settings, lag choices and the distinction between levels and changes all affect interpretation. A fitted coefficient or a small p-value does not, by itself, establish causation or a useful forecast.
The work strengthened my ability to reason about changing data and to explain numerical results in plain language. Those skills are useful when building software around financial models.
Scope and collaborators
This was analysis of course-supplied series. It did not establish a profitable trading strategy or measure forecasting performance on unseen market data.
I worked with Ajit Narayan Yadav on the submitted project. My sections were questions 5 and 6. The regression model-selection work elsewhere in the group notebook was his contribution.